
Section: Products / Zoom Attendance Dashboard
Who showed up?
The Zoom Attendance Dashboard watches every session your organization runs on Zoom, matches every attendee to the roster they belong to, and turns months of meetings into one grid anyone can read in seconds.
Configured and branded for your organization. Fixed setup quote, in writing.
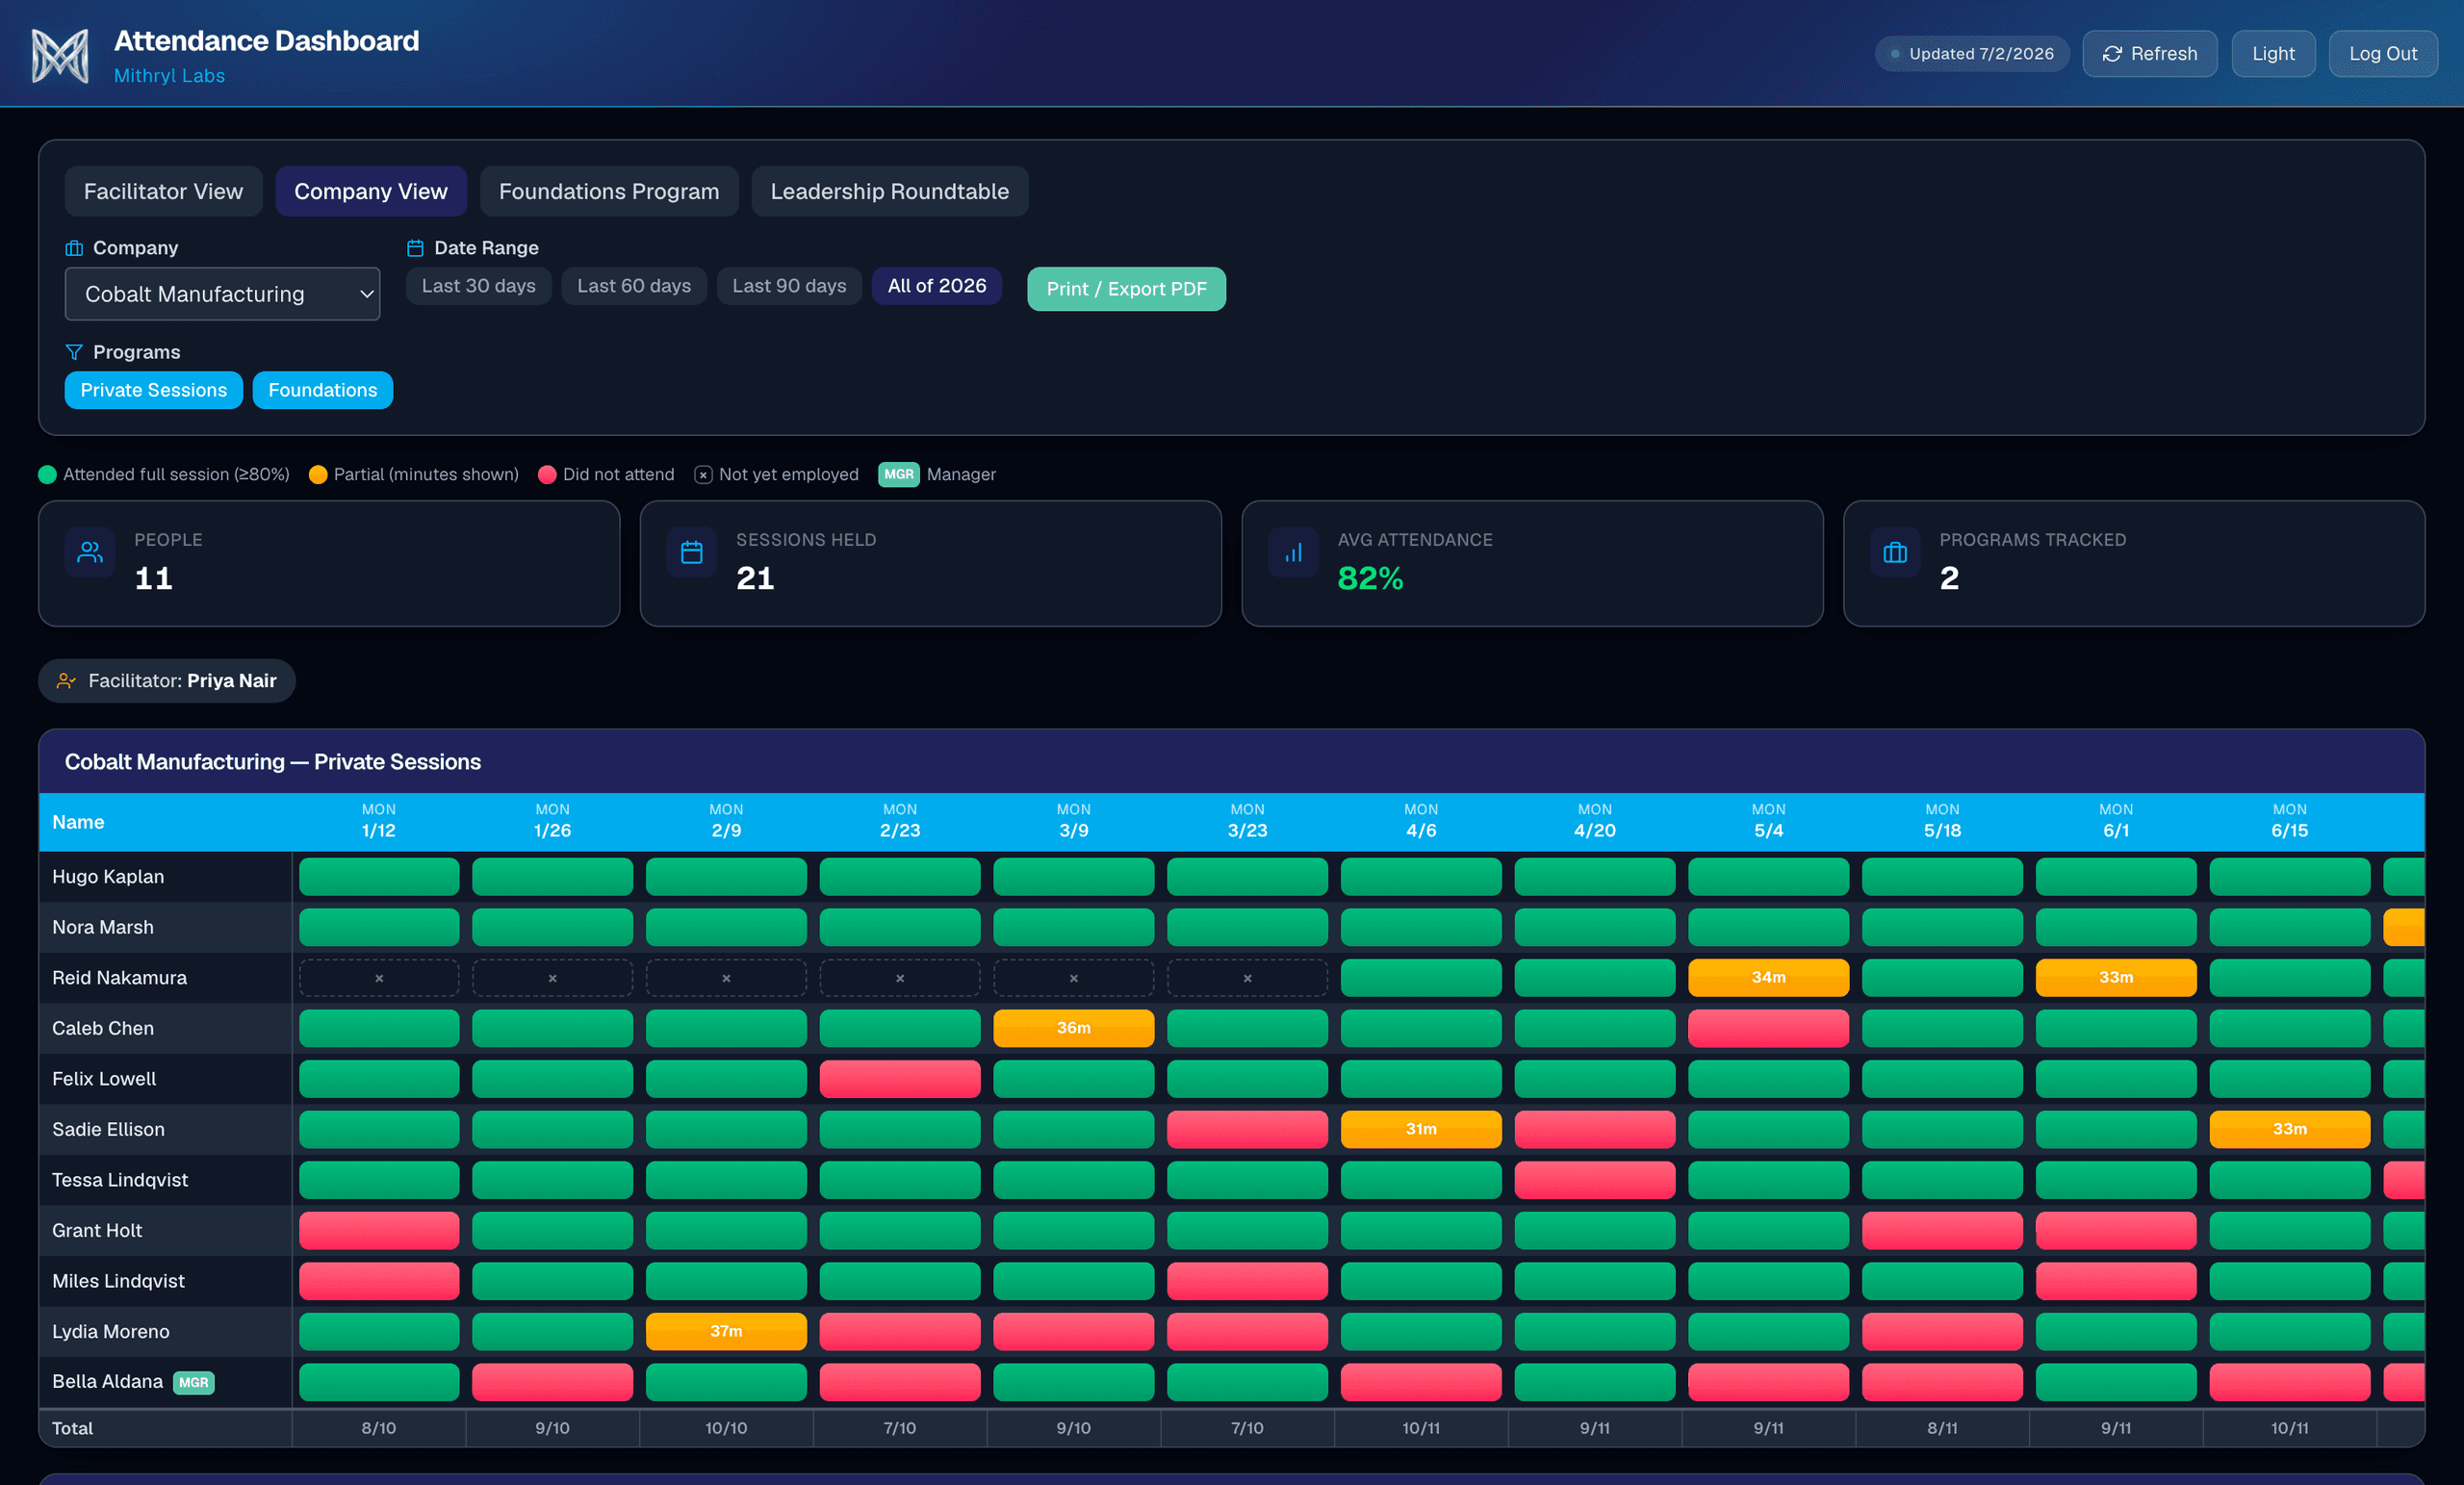
Shown with demo data. Every person and company in these screenshots is fictional.
Matches people
Zoom knows an email joined a call. The dashboard knows which client organization that person belongs to, even when logins and rosters do not line up neatly.
Sorts sessions
Recurring sessions, fixed-length classes, workshops, leadership groups: every meeting lands in the right program on its own, tuned to how your team actually titles meetings.
Keeps score
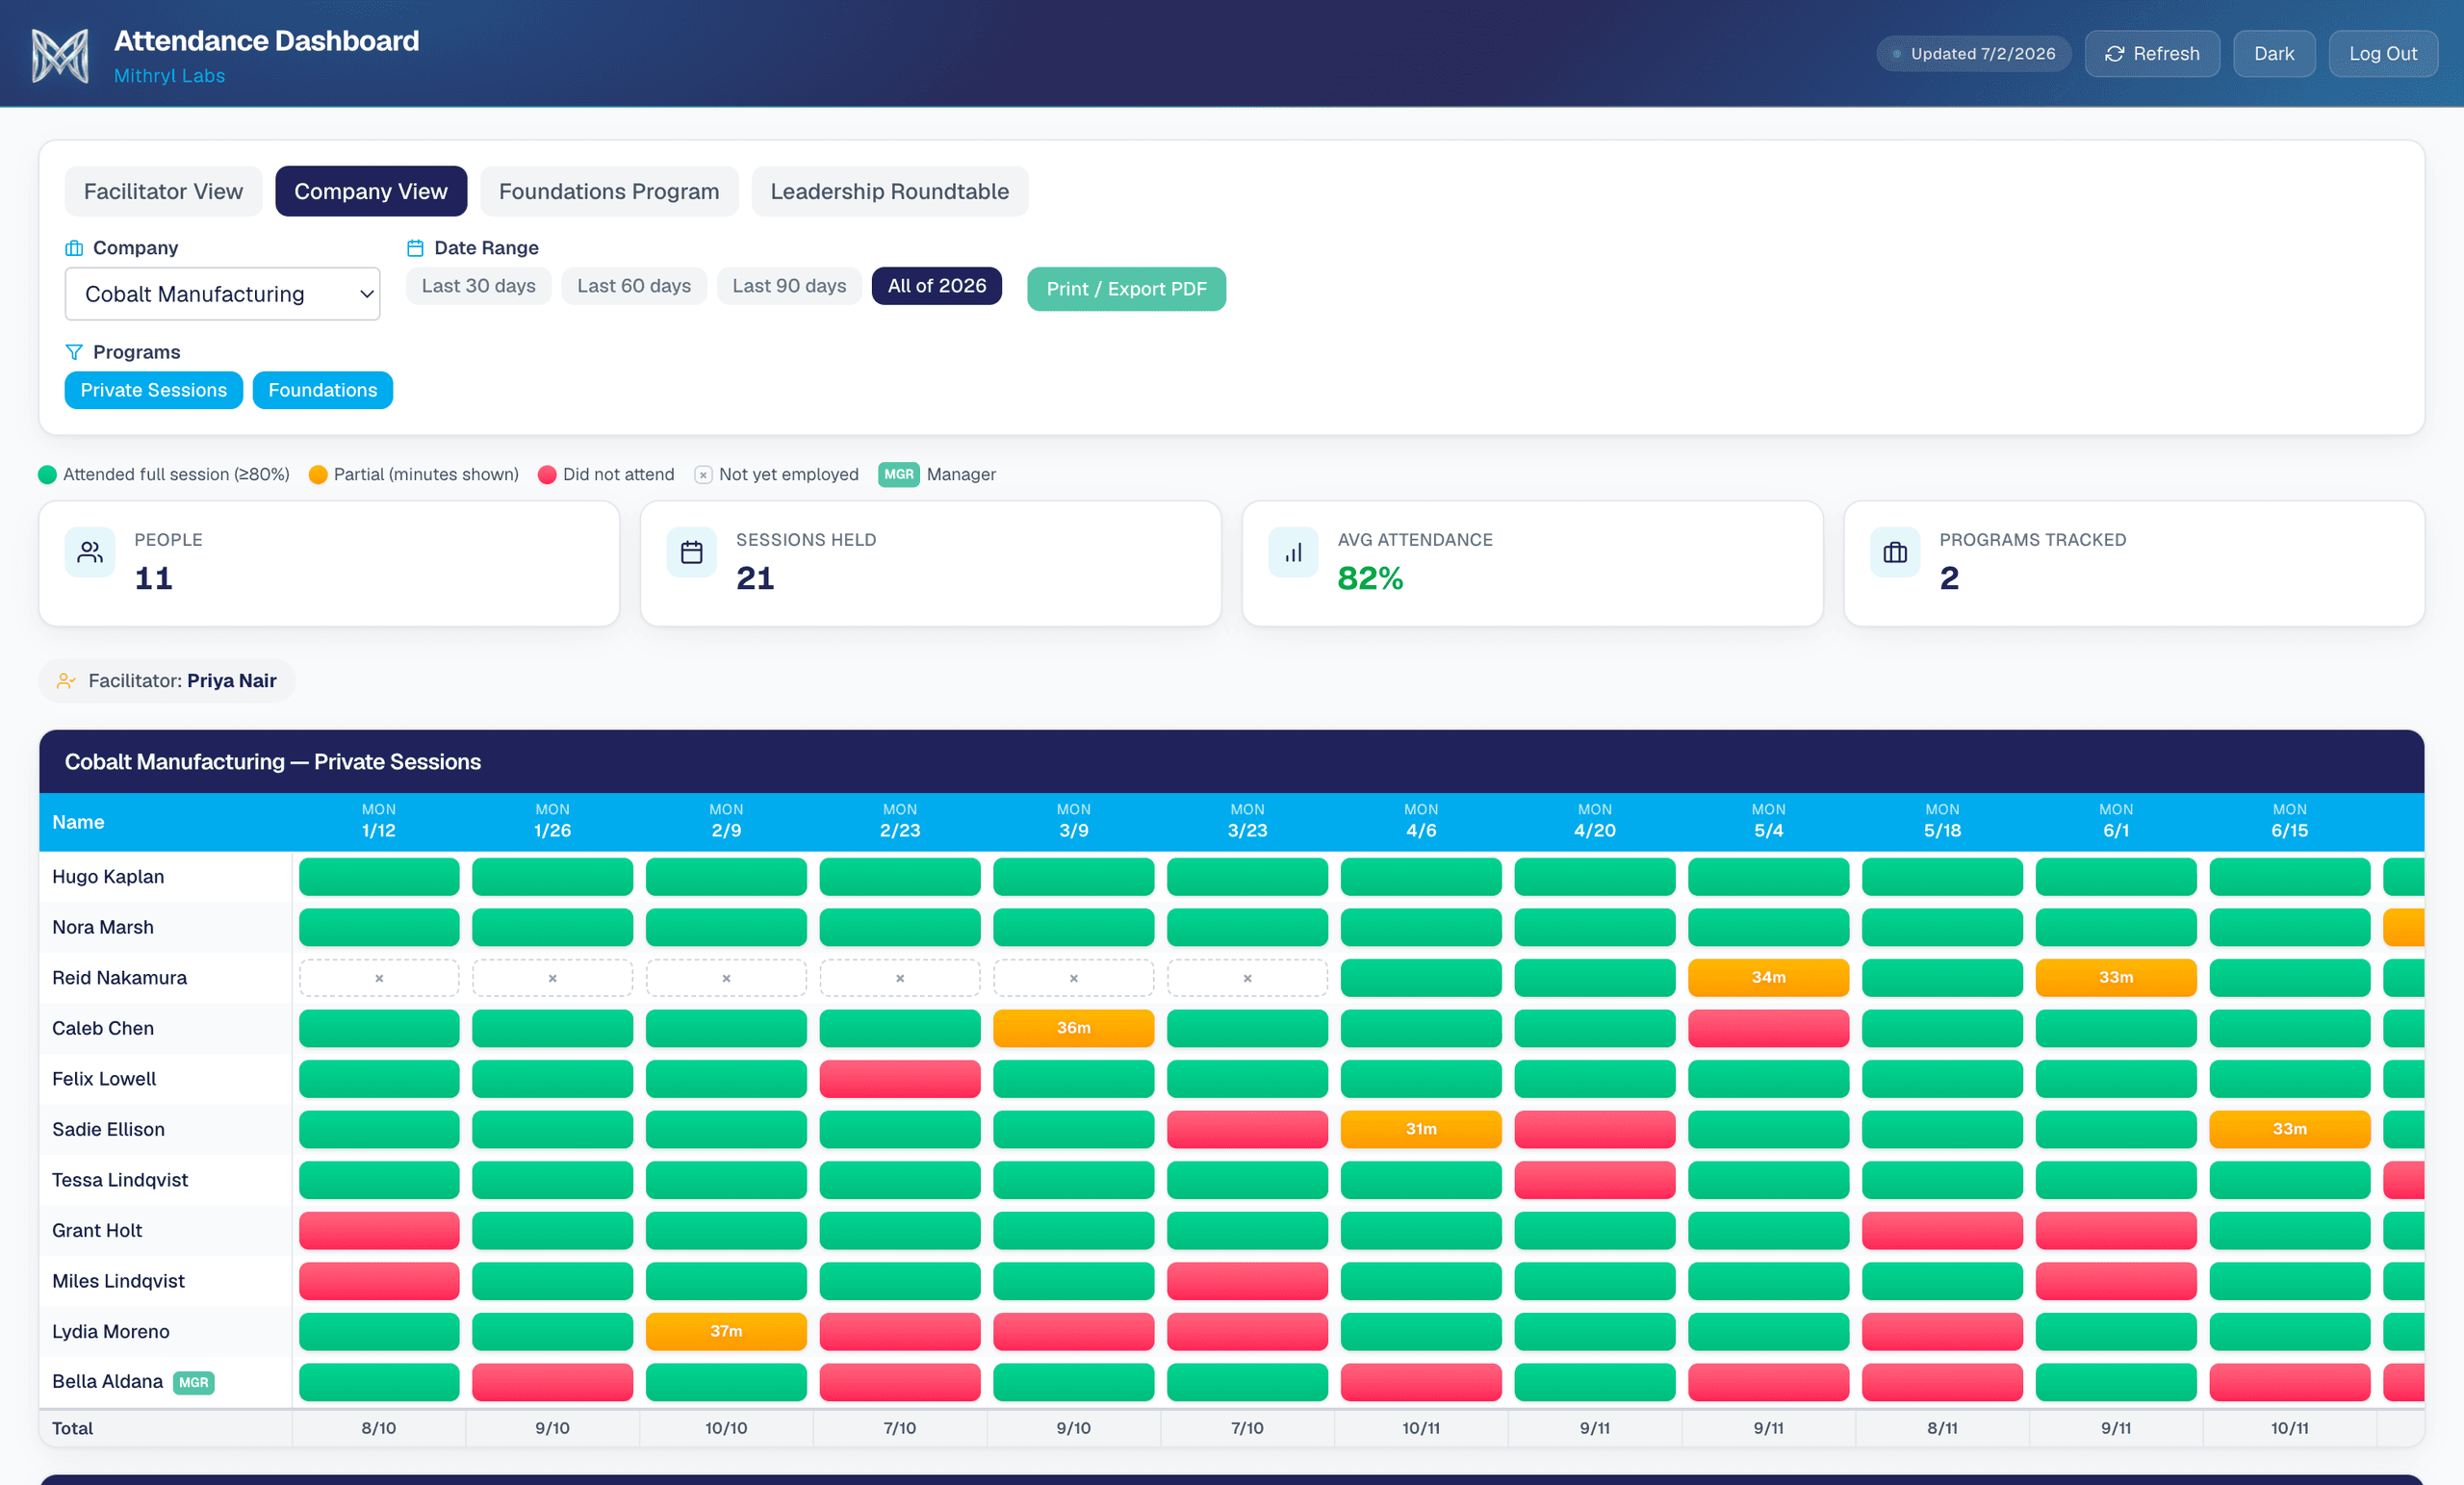
Full, partial, and missed attendance, color coded, with minutes shown for partials and rates rolled up per person, per session, and per program.
Facilitator view
Every facilitator, their whole roster.
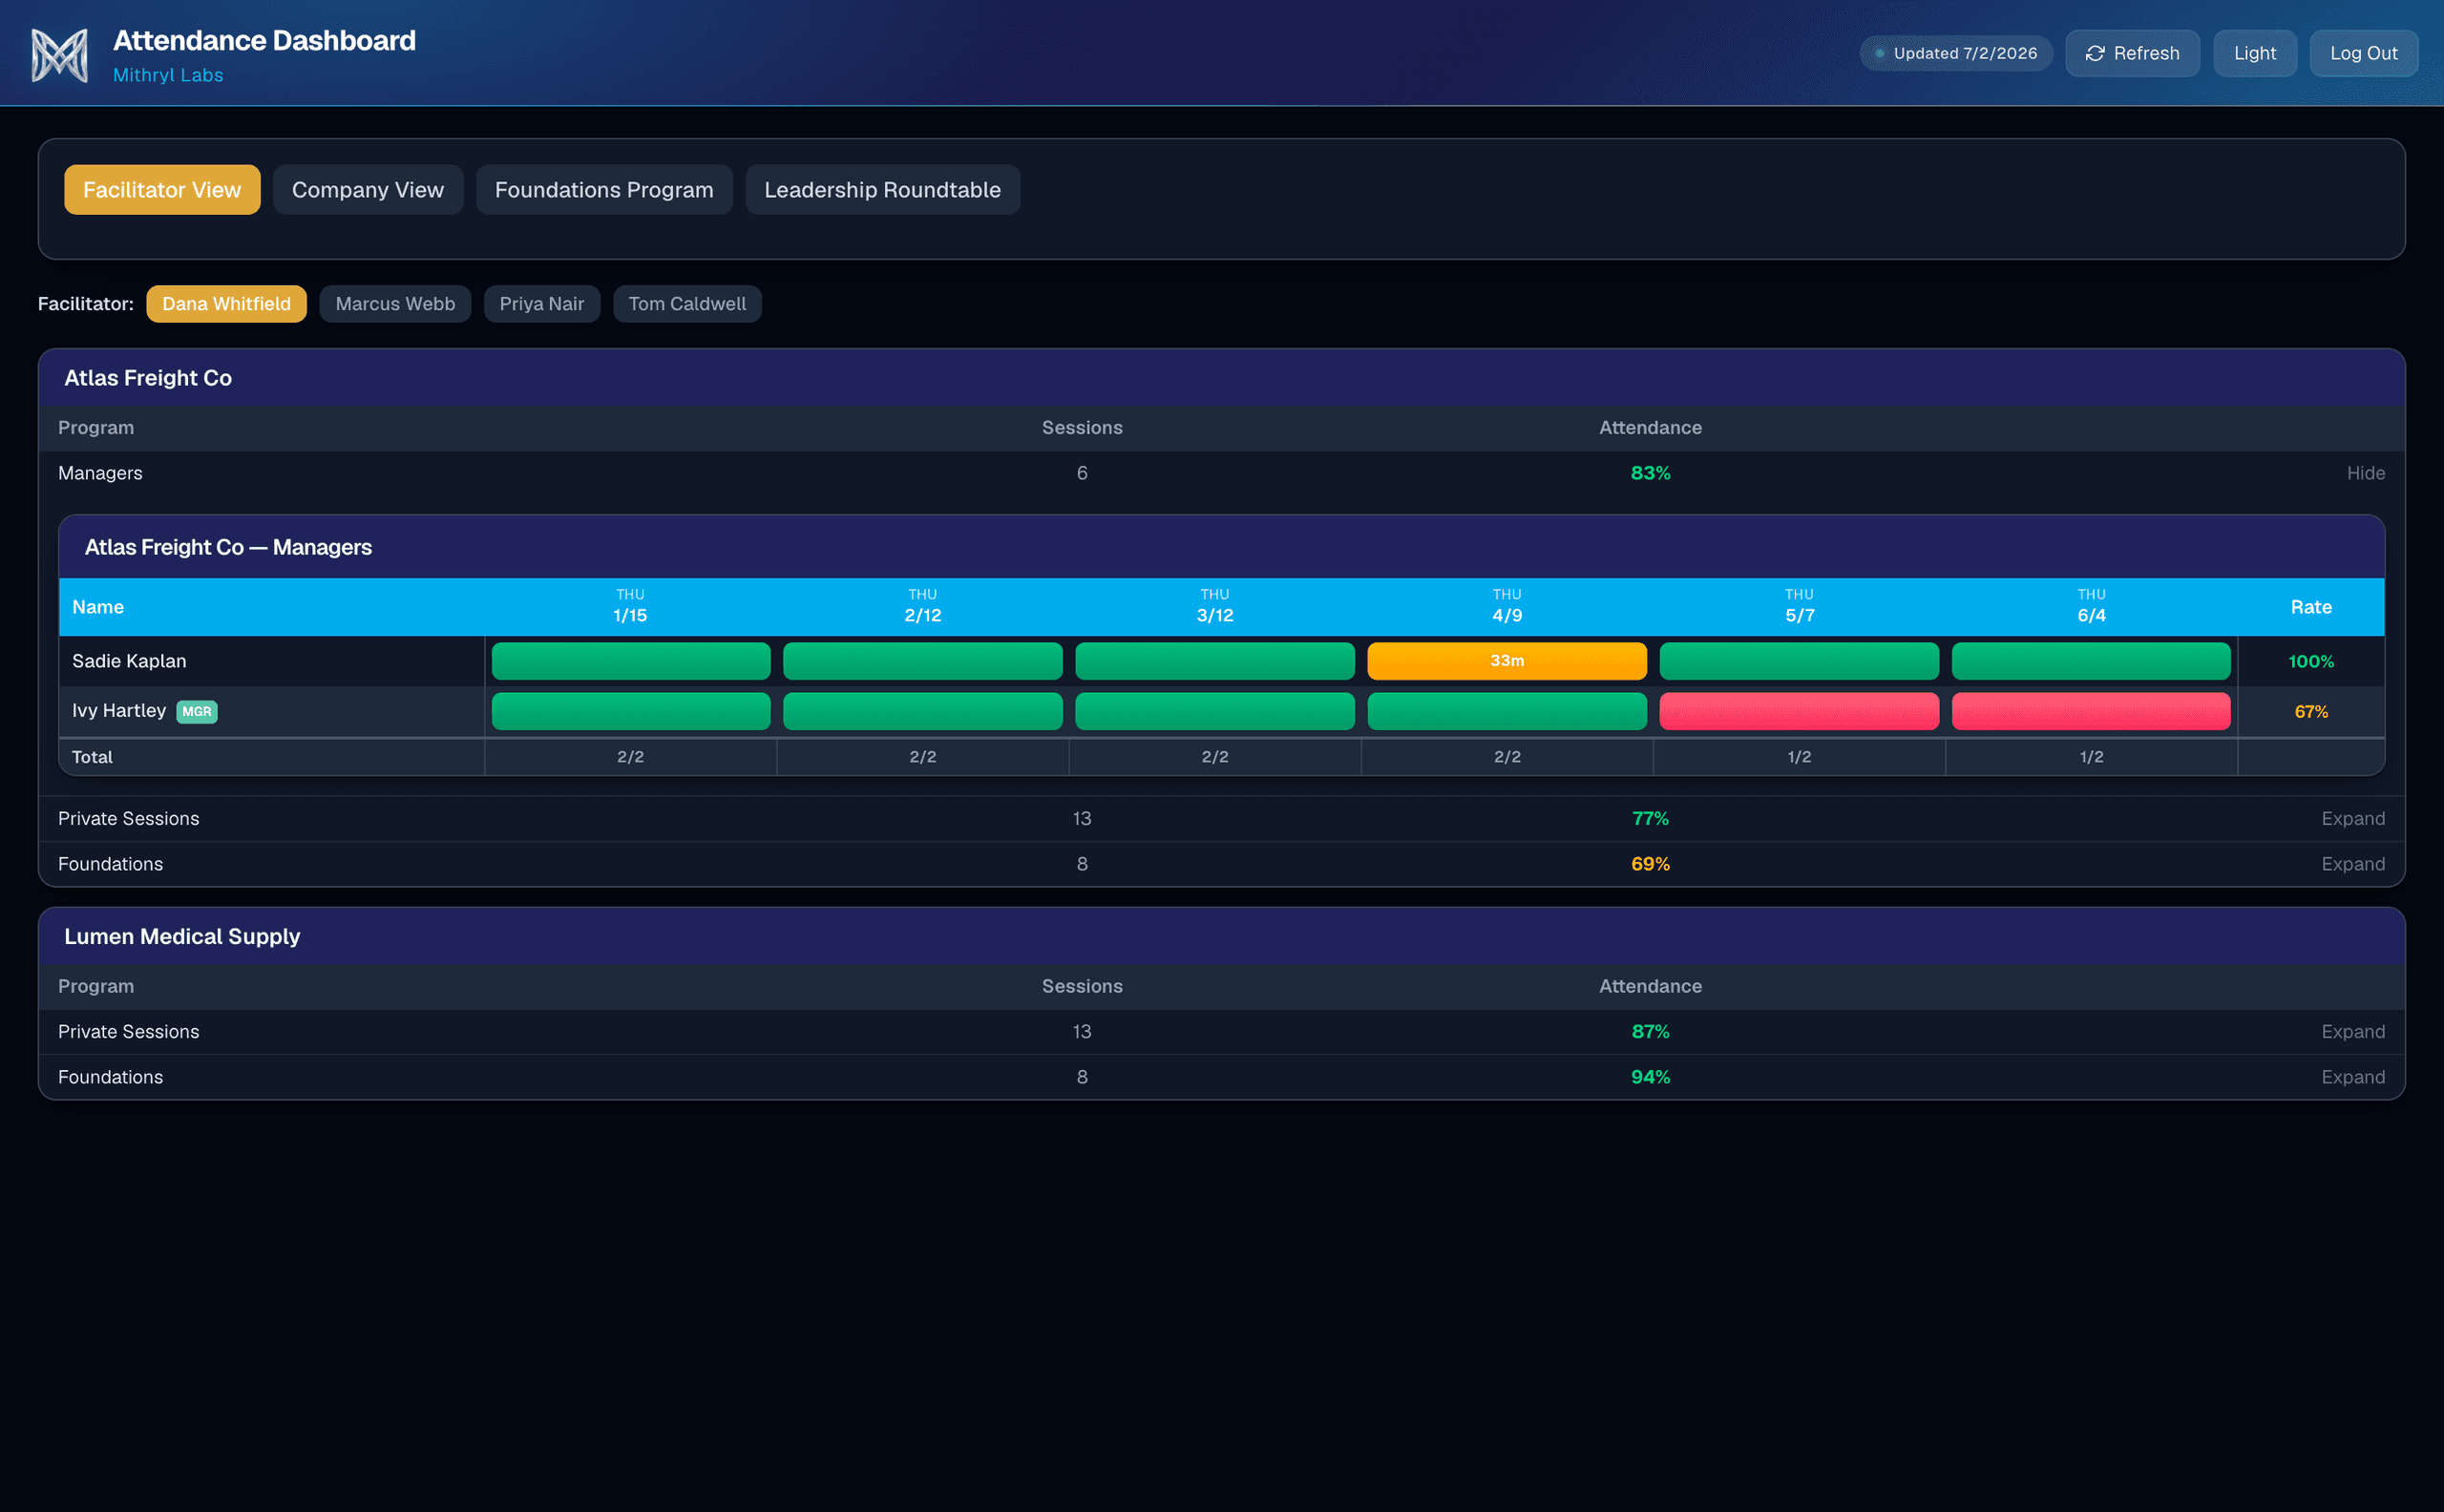
Pick a facilitator and every organization they run sessions for rolls up in one place: programs, session counts, attendance rates. Any number that looks off expands into the full grid behind it, one click deep.
Person drilldown
Click a name, get the receipts.
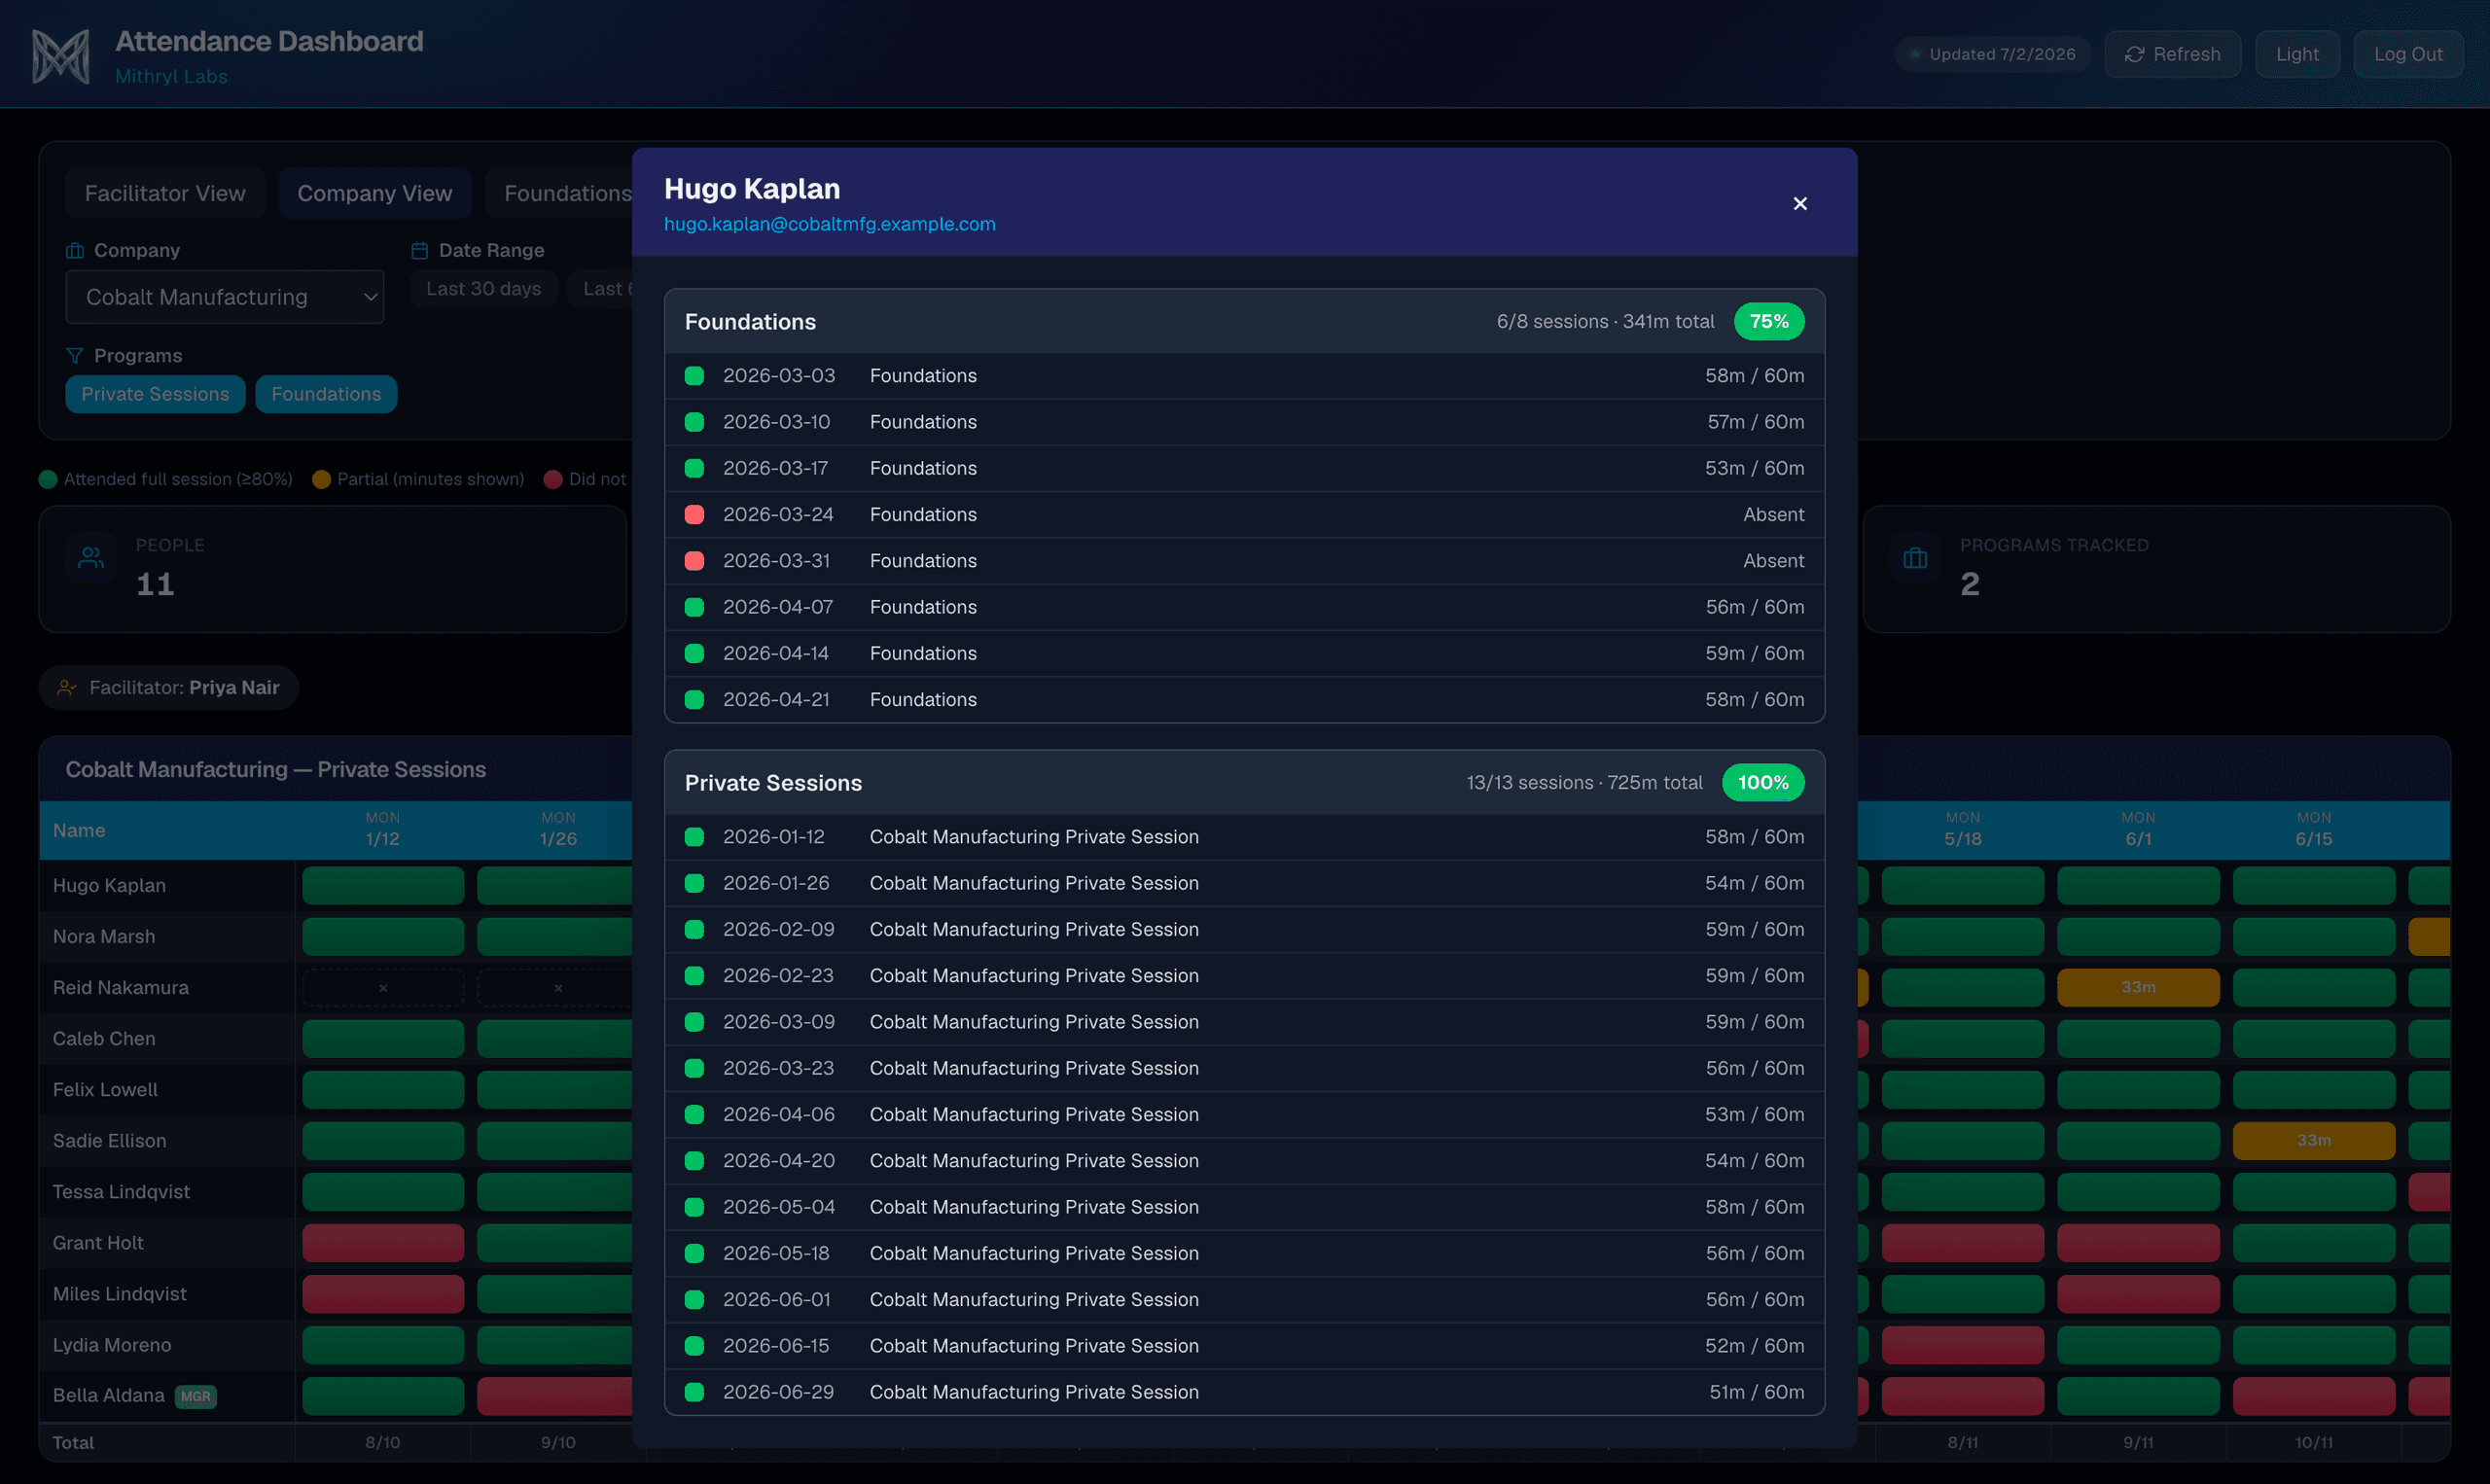
Every person carries a complete history across every program: which sessions they attended, how many minutes they stayed, exactly what they missed. Hard conversations about engagement stop being arguments about memory and start being reads of the record.
Fixed-length programs
Groups, tracked from kickoff to finish.
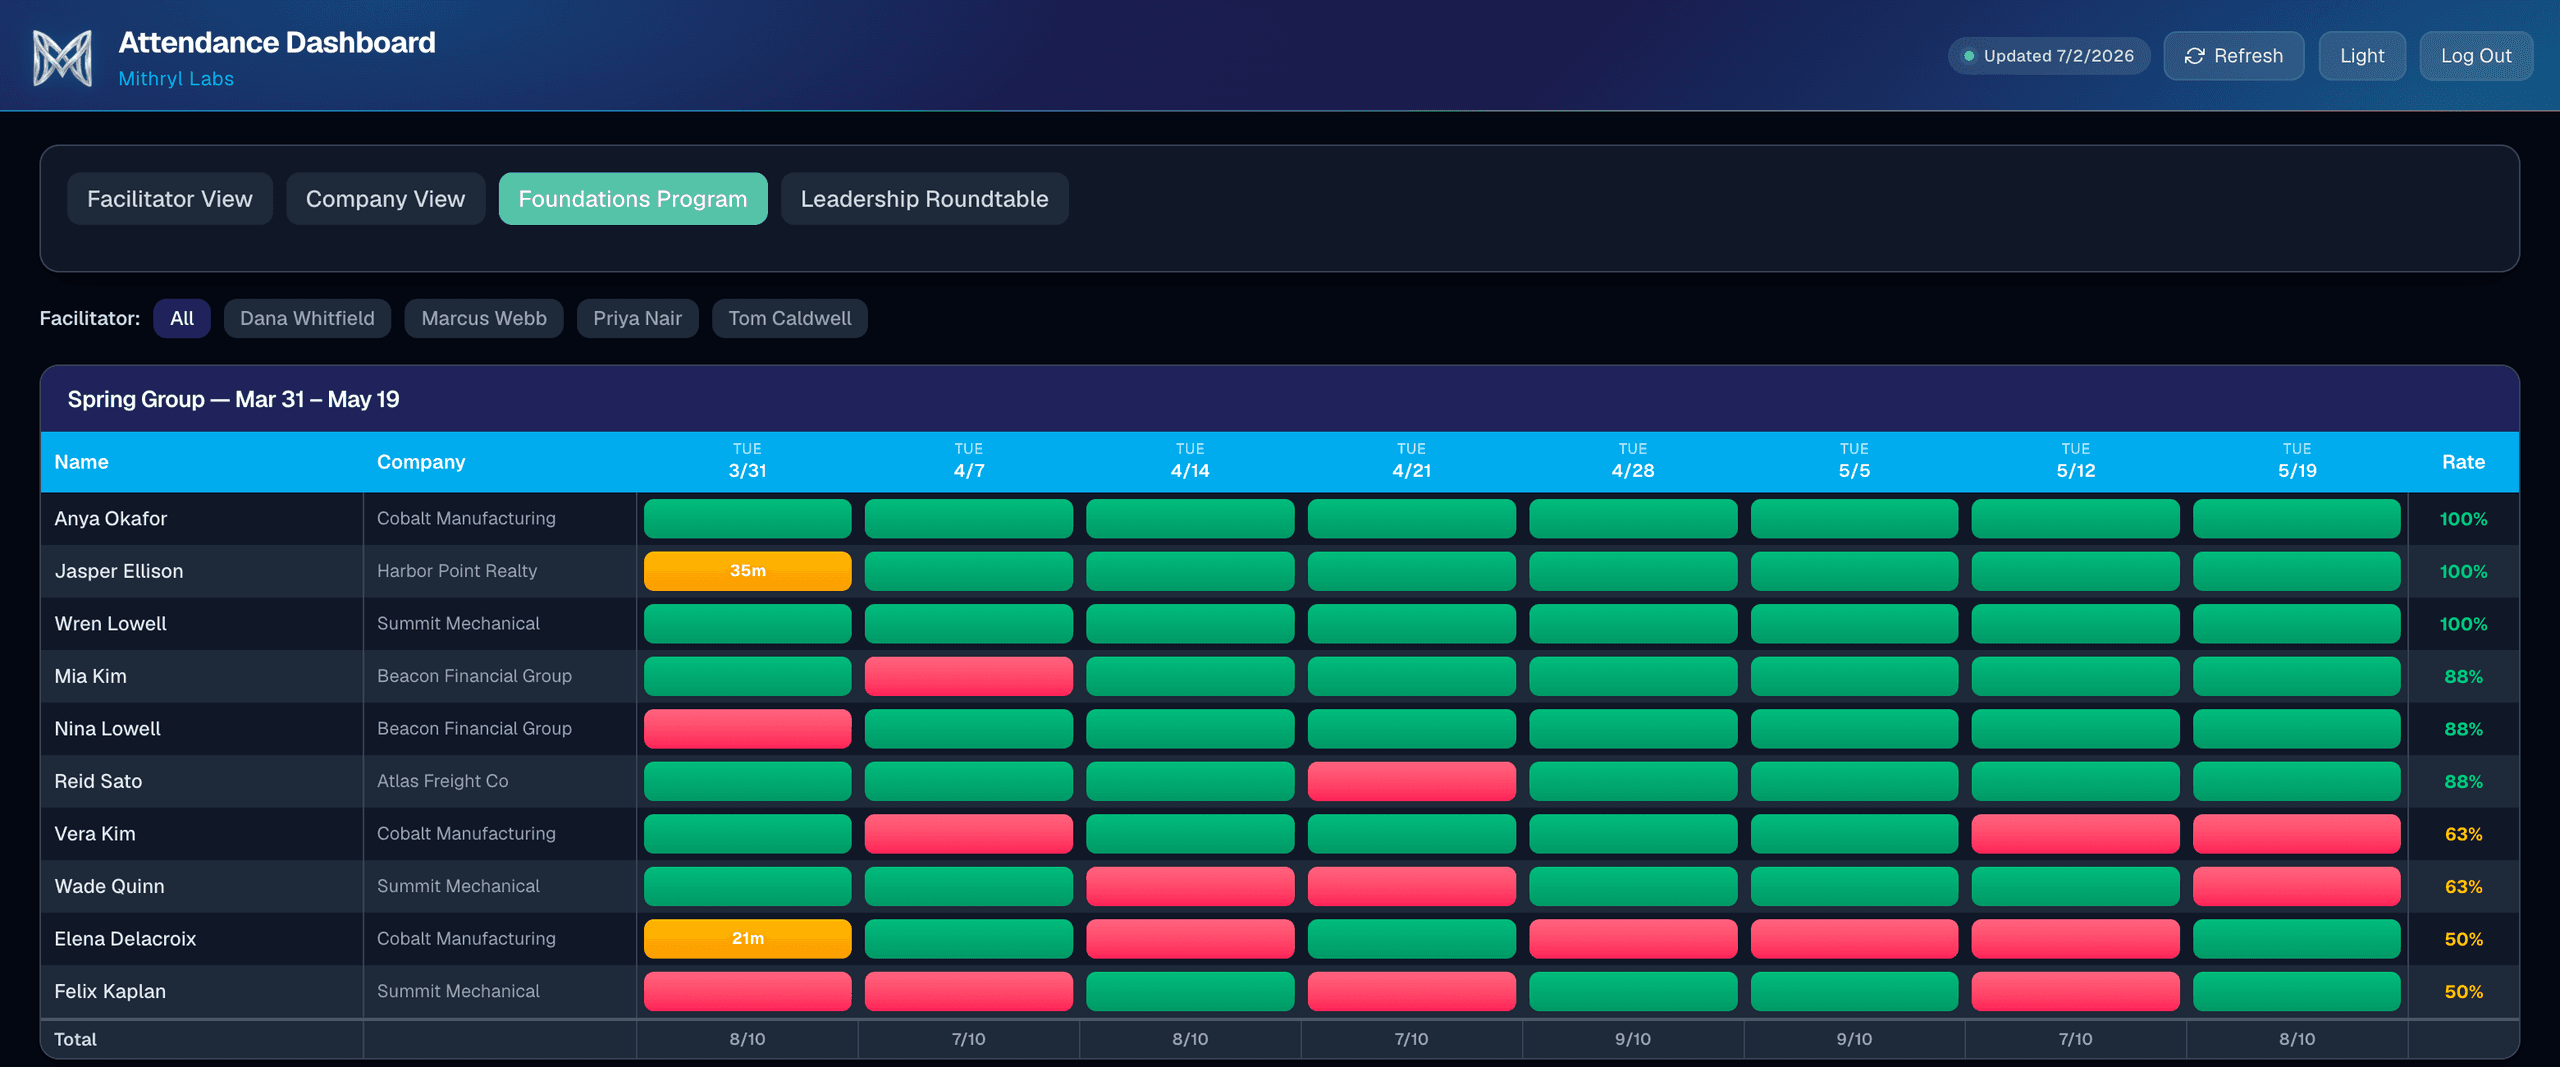
Fixed-length classes get their own view: rosters that span organizations, week-by-week grids, facilitator filters, and per-session totals. You know a group is drifting before week six, not after it wraps.
Client portal and branding
A window for every client, not the warehouse.
Optional per-company logins let each client sign in and see only their own people. The dashboard wears your logo and your colors, ships in light and dark, and prints clean PDF reports for the reviews you already run.
Always current
Fresh without anyone thinking about it.
The dashboard connects to Zoom and to wherever your roster already lives: a CRM, a maintained spreadsheet, a member list. It refreshes itself on a schedule. A refresh button is there for the mornings you want numbers right now. No exports, no copy-paste, no Monday spreadsheet ritual.
Straight answer on accuracy: the first weeks tune session sorting and people matching to how your meetings are actually titled and how your rosters actually look. That tuning is part of the engagement, and it ends. Once it reads true, it stays true.
Live in three steps.
01
Intake
One form covers it: your programs, client organizations, facilitators, and brand.
02
Configuration
Mithryl Labs connects your Zoom account and your roster source, applies your brand, and loads your meeting history.
03
Handoff
Your team signs in with a link and a password. A short optimization period dials in accuracy, then the dashboard maintains itself.
Fixed setup quote in writing. Optional monthly optimization while it dials in, cancel once it is.
Common questions
Asked before the call.
The dashboard fits any operation that runs scheduled sessions on Zoom: training firms, colleges and continuing education, certification programs, membership communities. These are the questions most of them start with.
What does it cost?
Every setup is quoted fixed, in writing, after a 30-minute call. One setup fee, no per-seat pricing, nothing metered.
Is this a subscription?
No. The optional monthly optimization exists only while accuracy dials in, and it ends when that does. After that there is nothing to keep paying: the dashboard keeps running, connected to accounts you own, hosting included.
What do we need on our side?
A Zoom account (or several) and one reliable answer to who belongs to which organization and program. That answer can live in a CRM, a maintained spreadsheet, or a member list. Wiring it in is part of setup, not your problem. And when attendees join with company email addresses, the dashboard can build rosters from those on its own.
Do our attendees have to change anything?
Nothing. No app to install, no check-in links, no registration changes. Attendance comes from Zoom's own meeting records, so sessions run exactly the way they already do.
How current is the data?
The dashboard refreshes itself on a schedule, daily for most deployments, and the refresh button pulls fresh numbers any time you want them sooner.
How long does setup take?
Once your intake form comes back, the dashboard is typically live within two weeks, loaded with your current year of session history. The optimization period then dials in accuracy while your team is already using it.
We have several hosts. Does it see all of them?
Yes. Sessions run by any host, across one or more Zoom accounts, land in the same dashboard and the same grids.
Who can see our numbers?
Only people you hand a password to. Your team signs into the full dashboard, and each client organization can get its own login that shows only its own people. The underlying data stays in your Zoom account and your own roster source.
See it against your own meetings.
Bring one real month of sessions to a 30-minute call and see how the dashboard would read it. No charge, no pitch.
Looking for something else? See all products.